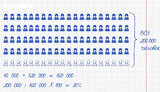
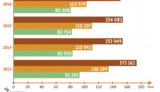
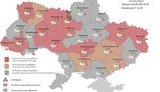
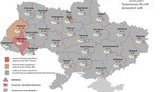
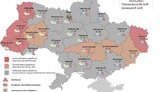
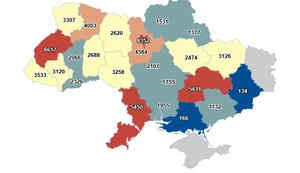
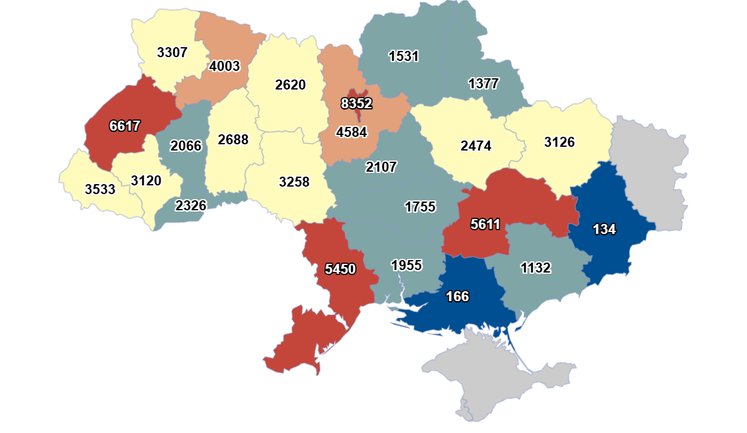
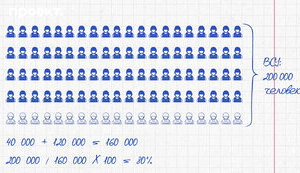
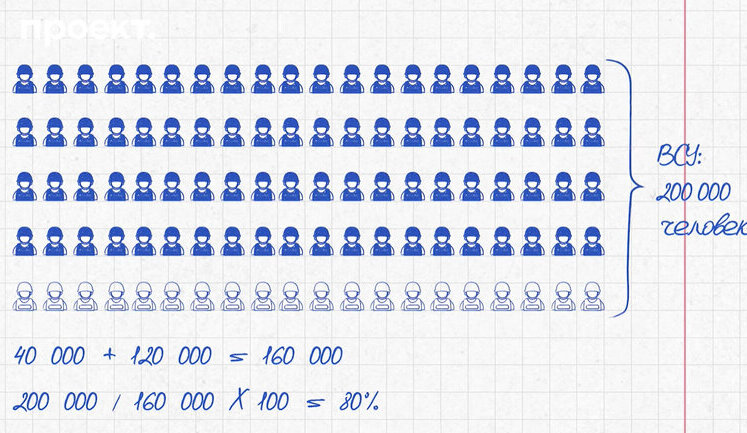
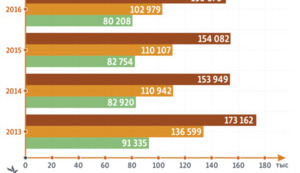
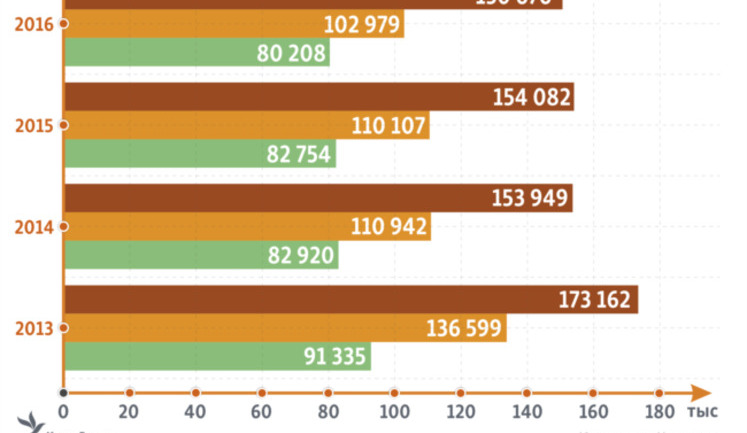
Statistics play a crucial role in understanding the impact of major events in Ukraine, including the war and the COVID-19 pandemic. Recent reports from The Economist indicate that Ukraine's losses in the ongoing conflict exceed 60,000 soldiers, highlighting the devastating human cost of the war. Detailed infographics illustrate these losses, with estimates reaching up to 100,000 killed and 400,000 wounded. Simultaneously, Ukraine has been grappling with significant COVID-19 case numbers, with daily reports showing fluctuations in new infections. Keeping track of these figures helps gauge the pandemic's impact, allowing for informed public health responses. Combining these statistics provides a clearer picture of the challenges Ukraine faces in 2024.
What are the recent statistics on Ukraine's war casualties?
Ukraine’s war has seen substantial losses. According to The Economist, at least 60,000 soldiers have been killed, while up to 400,000 have been wounded. These figures underscore the profound impact on the nation.
How reliable are the statistics reported on Ukraine's military equipment losses?
Investigations have revealed discrepancies in reported losses, with some sources claiming destruction of more equipment than Ukraine possessed. Such claims necessitate careful scrutiny and verification to ascertain their accuracy.
What is the current trend in COVID-19 cases in Ukraine?
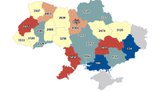
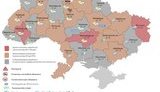
Ukraine has reported varying daily COVID-19 cases, with peaks of over 40,000 cases at certain points. Continuous monitoring of these statistics helps understand the pandemic's progression and guides public health measures.
How does the statistical reporting impact Ukraine's public health policies?
Accurate and timely statistical reporting on COVID-19 cases allows health officials to tailor responses, allocate resources effectively, and implement necessary restrictions to mitigate the virus's spread and impact.
What role do infographics play in understanding war casualties and COVID-19 statistics?
Infographics provide a visual representation of complex data, making it easier to grasp the scale and implications of war casualties and COVID-19 cases. This format aids in public comprehension and policy formulation.
How can the public access credible statistics regarding Ukraine’s war and COVID-19?
Public access to credible statistics is facilitated by reputable sources such as international organizations, investigative publications, and official health departments that provide verified data and comprehensive reports.
What have been the major challenges in reporting accurate COVID-19 statistics in Ukraine?
Challenges include data collection limitations, potential underreporting, testing capacity issues, and the need for reliable data integration. Overcoming these requires investment in health infrastructure and transparent information sharing.